← Back to Franklin County Public Health homepage
Over the next few weeks the dashboard will be modified to align with the new CDC metrics. Please continue to check this space and note that some items will be phased out or removed. Thank you.
Last updated . Data source: CDC COVID-19 Data Tracker. Data shown above includes the cities of Columbus and Worthington. Please note that the calculated rates are based on the most accurate data available at the time.
| 7 Day Time Period | Total Reported New Cases Per 100k | New Admissions Per 100k | % Staffed Inpatient Beds Occupied by COVID-19 Patients |
Use the highest level that applies to your community.
|
New COVID-19 Cases Per 100k people in the past 7 days
|
Indicators | Low | Medium | High |
|---|---|---|---|---|
| Fewer than 200 | New COVID-19 admissions per 100,000 population (7-day total) | <10.0 | 10.0-19.9 | ≥20.0 |
| Percent of staffed inpatient beds occupied by COVID-19 patients (7-day average) | <10.0% | 10.0-14.9% | ≥15.0% | |
| 200 or more | New COVID-19 admissions per 100,000 population (7-day total) |
NA
|
<10.0 | ≥10.0 |
| Percent of staffed inpatient beds occupied by COVID-19 patients (7-day average) |
NA
|
<10.0% | ≥10.0% |
Excludes the cities of Columbus and Worthington.
ODH updates their numbers at 2 pm everyday and may not include our case counts at this time. For state case count, go to https://coronavirus.ohio.gov.
NOTE: As of September 1, 2021, criteria to distinguish a new case has changed. For more information, please see the Ohio IDCM.
| 2020 | 2021 | 2022 | CUMULATIVE | |
|---|---|---|---|---|
| Total Cases | ||||
| Confirmed Cases | ||||
| Probable Cases | ||||
| Asymptomatic Cases | ||||
| Symptom Onset Date Range | ||||
| Hospitalizations | ||||
| Deaths | ||||
| Cases, Females | ||||
| Cases, Males | ||||
| Age Range | ||||
| Total Cases Per 100k |
What to look for: Shows whether the trend in cases is increasing or decreasing by the number and rate of COVID-19 over time.
Beginning in mid-October, the decrease in percent of cases linked to another known COVID-19 case is likely caused by the surge in virus spread and subsequent increase of cases in the community. When community-wide spread increases and numbers of new cases exceed the capacity to investigate cases, knowing if a person with COVID-19 is linked to another person with COVID-19 decreases.
What to look for: High percentages are good, and 80% or greater is best. Note that the measures for the most recent 4 weeks tend to be less accurate because of delayed information reporting and collection.
What to look for: The goal is to have greater than 80% of tests reporting results to public health within 48 hours. When test results take more than 48 hours to report, the effectiveness of helping people with COVID-19 and people they may have infected decreases. Note that the measures for the most recent 4 weeks tend to be less accurate because of delayed information reporting and collection.
Note that the measures for the most recent 4 weeks tend to be less accurate because of delayed information reporting and collection.
Note that the measures for the most recent 4 weeks tend to be less accurate because of delayed information reporting and collection.
Note that the measures for the most recent 4 weeks tend to be less accurate because of delayed information reporting and collection.
Cases by race and ethnicity are updated as additional data are available. Race and ethnicity categories will not align exactly with population totals because of incomplete data.
What to look for: Significant differences between the “% of all cases” and “% of population” for each race/age group indicate potential inequities in how the disease is being contracted and/or treated. For example, if 50% of all cases are among whites but whites are 75% of the population, then the data indicate non-white people are likely impacted more from COVID-19. Note that the measures for the most recent 4 weeks tend to be less accurate because of delayed information reporting and collection.
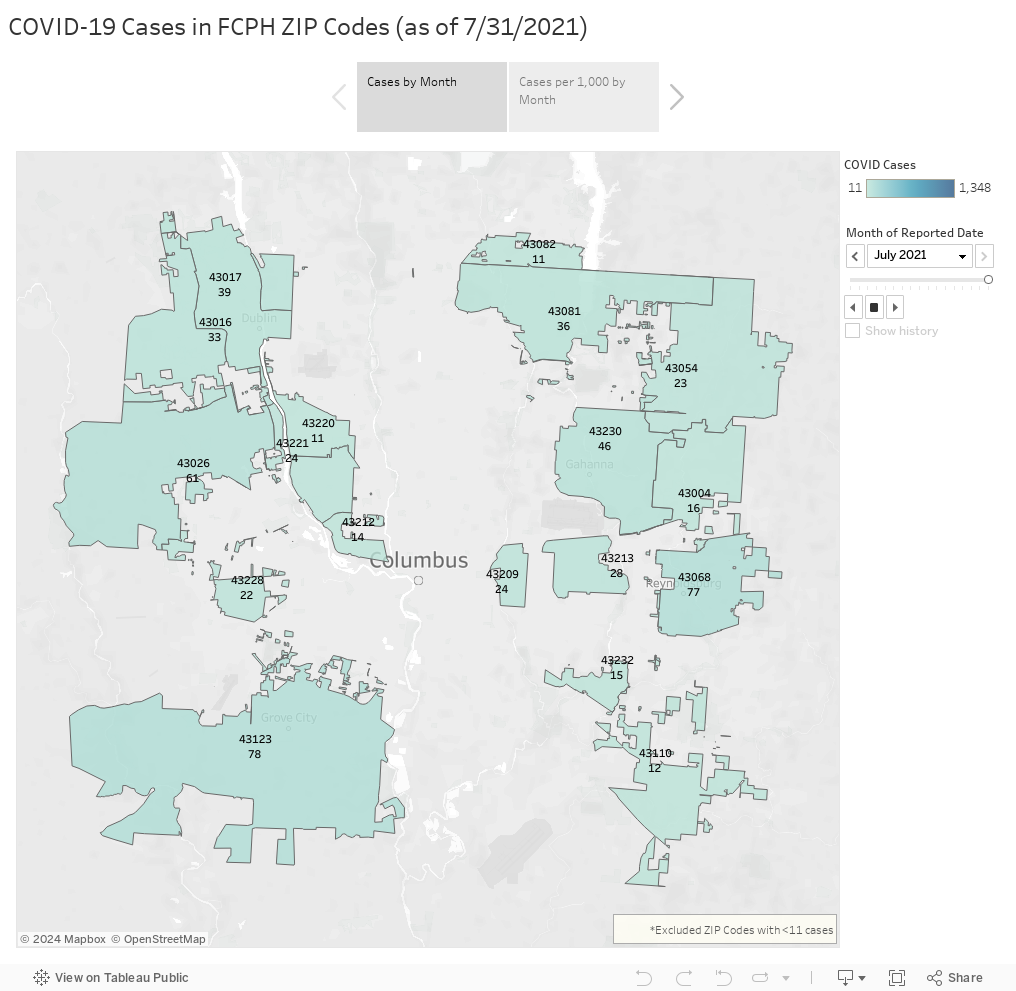
Note: Excludes case counts <11
© 2022 Franklin County Public Health - All rights reserved.